0

ecommerce/course.login

PowerPivot, Power Query & DAX in Excel

**This course includes practice exercise files** Learn Microsoft Power BI and Power Pivot, Power Query and DAX in Excel in this two-course bundle from Microsoft experts Simon Sez IT.

4.5
(302 ratings) 750 students


What you will learn

Learn to unlock advanced Excel tools Power Query and Power Pivot as well as Power BI in this two-course bundle!
Analyze huge buckets of data to make informed business decisions
Become confident cleaning, sorting and linking data from various sources
Learn via expert instruction and exercises designed to have you performing complex analysis
How to create stunning, interactive dashboards with Power BI
How to share your analysis and dashboards using Power BI Online
To import CSV and Excel files into Power BI Desktop
All about DAX including using the COUTROWS, CALCULATE, and SAMEPERIODLASTYEAR functions
All about using the card visual to create summary information
How to create amazing visuals, such as clustered column charts, maps, and trend graphs
How to use Slicers to filter your reports
How to edit the interactions between your visualizations and filter at visualization, page, and report level

Who should take this training

Prerequisites

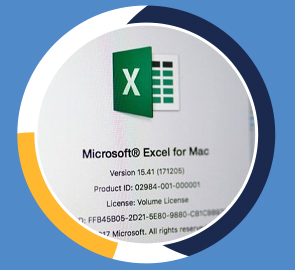
  • You'll need a copy of Microsoft Excel that is compatible with the Power Pivot tool.
  • A good understanding of MS Excel. This is an advanced level course.
  • Power BI Desktop installed on your machine is required to take the practice exercises
  • A good knowledge of MS Excel is advised but not necessary

Target audience

  • Advanced Excel Users

About this training


In this advanced Excel course, we look at three crucial advanced Excel features Power Pivot, Power Query, and DAX. This suite of Excel functions allows you to manipulate, analyze, and evaluate millions of rows of data from Excel or other databases.

***Exercise and demo files included***

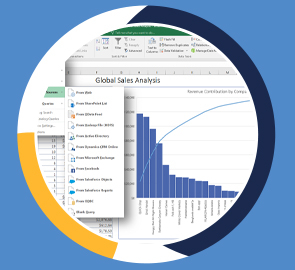
  • How to get started with Power Query

  • How to connect Excel to multiple workbooks

  • How to get data from the web and other sources

  • How to merge and append queries using Power Query

  • How the Power Pivot window works

  • How to set up and manage relationships in a data model

  • How to create a PivotTable to display your data from the Power Pivot data model

  • How to add calculated columns using DAX

  • How to use functions such as CALCULATE, DIVIDE, DATESYTD in DAX

  • All about creating Pivot Charts and PivotTables and using your data model

  • How to use slicers to adjust the data you display

Power BI

In this Power BI course, we start by looking at Power Query, and how to use this tool to organize and clean our data. We then show you how to build a Data Model and relate separate tables. After that, we teach you all about the data analysis language DAX in Power BI. Finally, we look at how to present this data using the charts and graphs available.

  • What is Power BI and why you should be using it.

  • To import CSV and Excel files into Power BI Desktop.

  • How to use Merge Queries to fetch data from other queries.

  • How to create relationships between the different tables of the data model.

  • All about DAX including using the COUTROWS, CALCULATE, and SAMEPERIODLASTYEAR functions.

  • All about using the card visual to create summary information.

  • How to use other visuals such as clustered column charts, maps, and trend graphs.

  • How to use Slicers to filter your reports.

  • How to use themes to format your reports quickly and consistently.

  • How to edit the interactions between your visualizations and filter at visualization, page, and report level.


Course Language : EN
On-demand video
Full lifetime access to videos
Downloadable resources
Assignments
Certificate of Completion

Training options

Only Videos

$ 30

  • Full lifetime access to videos
  • Downloadable resources
  • Certificate of Completion
  • Hours of Individual Coaching

Blended

$ 550

  • Full lifetime access to videos
  • Downloadable resources
  • Certificate of Completion
  • 10 Hours of Individual Coaching
Save 10%

Blended

$ 1040 $ 963

  • Full lifetime access to videos
  • Downloadable resources
  • Certificate of Completion
  • 20 Hours of Individual Coaching
Save 20%

Blended

$ 1590 $ 1272

  • Full lifetime access to videos
  • Downloadable resources
  • Certificate of Completion
  • 30 Hours of Individual Coaching

Course Content

1. Introduction
1. Welcome and Overview 03:03 mins
2. What is Power Query? 05:24 mins
3. What is Power Pivot? 03:44 mins
2. Getting Started with Power Query
1. Exploring the Power Query Editor 06:30 mins
2. Common Power Query Transformations 08:59 mins
3. Editing an Existing Query 09:55 mins
4. Import Multiple Files from a Folder 11:07 mins
5. Connect to Data in Another Excel Workbook 02:11 mins
6. IMPORTANT: Checking the Location of your Query's Source 03:34 mins
7. Get Data From the Web 05:40 mins
Practise Exercise 01:05 mins
Demo - Exploring the power query editor
Demo - Transformations
Demo - Editing an Existing Query
Demo - Import Multiple Files from a Folder
Demo - Connect to Data in Another Excel Workbook
Demo - Checking the Location of your Query's Source
Demo - Get Data From the Web
Practise Exercise
3. Useful Power Query Features
1. Unpivoting Columns 05:33 mins
2. Combine Data from Multiple Tables with Merge Queries 06:11 mins
3. Use Merge Queries to Compare Two Tables 05:03 mins
4. Stack Data into One Table with Append Queries 06:03 mins
5. Duplicating and Referencing Queries 09:10 mins
6. Grouping and Aggregating Data 07:53 mins
7. Conditional Columns in Power Query 07:14 mins
Practise Exercise 01:15 mins
Demo - Unpivoting Columns
Demo - Merge Queries
Demo - Use Merge Queries to Compare Two Tables
Demo - Stack Data into One Table with Append Queries
Demo - Duplicating and Referencing Queries
Demo - Grouping and Aggregating Data
Demo - Conditional Columns in Power Query
Practise Exercise
4. Creating the Data Model
1. Enable the Power Pivot Add-In 01:55 mins
2. Understanding the Power Pivot Window 04:43 mins
3. Creating Relationships Between tables 05:03 mins
4. Managing the Relationships of the Model 03:02 mins
5. Creating a PivotTable from the Data Model 04:42 mins
6. Hide Fields from Client Tools 03:20 mins
7. Grouping Queries 04:34 mins
Practise Exercise 00:49 mins
Demo - Enable the Power Pivot Add-In
Demo - Understanding the Power Pivot Window
Demo - reating Relationships Between tables
Demo - Managing the Relationships of the Model
Demo - Creating a PivotTable from the Data Model
Demo - Hide Fields from Client Tools
Demo - Grouping Queries
5. Introduction to DAX
1. Why use DAX? 03:15 mins
2. Creating Calculated Columns with DAX 05:09 mins
3. Creating your First DAX Measure 06:17 mins
4. The COUNTROWS Function 05:10 mins
5. SUMX and RELATED Functions 04:45 mins
Practise Exercise 00:50 mins
Demo - Calculated Columns
Demo - First DAX Measure
Demo - The COUNTROWS Function
Demo - SUMX and RELATED
6. More DAX Measures
1. Create a Date Table in Power Pivot 08:46 mins
2. The CALCULATE Function 03:31 mins
3. The DIVIDE Function 03:10 mins
4. Using the DATESYTD Function 02:22 mins
5. Calculate the Percentage of a Total 06:18 mins
Practise Exercise 01:06 mins
Demo - Create a Date Table in Power Pivot
Demo - The CALCULATE Function
Demo - Divide function
Demo - Using the DATESYTD Function
Demo - Calculate the Percentage of a Total
7. Using PivotTables and Slicers
1. Create PivotTables and PivotCharts 11:57 mins
2. Using Slicers with your PivotTables 06:22 mins
3. Create a Top 10 PivotTable 08:26 mins
Practise Exercise 00:47 mins
Demo - Pivottables and pivotcharts complete
Demo - Using Slicers with your PivotTables
Demo - Create a Top 10 PivotTable
8. Closing
Wrap Up 01:26 mins

Request more information

Similar courses

Join our mail list for news