0

ecommerce/course.login

Excel Dashboard

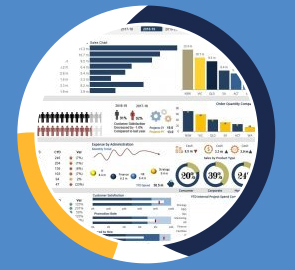
Create impressive, interactive Dashboards in Excel, from scratch! **Includes exercises and two, follow-along Dashboard Projects**

4.5
(245 ratings) 733 students


What you will learn

About Dashboard architecture and inspiration
How to prepare data for analysis (cleaning data)
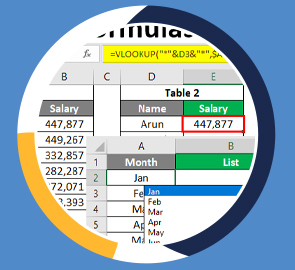
Useful formulas for creating dashboards in Excel
How to create and edit Pivot Tables in Excel
How to create Pivot Charts from Pivot Tables
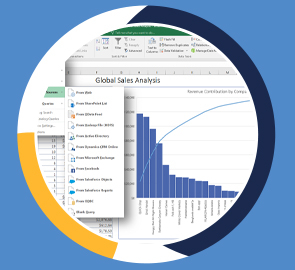
Advanced chart techniques in Excel
How to add interactive elements (form controls) into your dashboards
How to create a Sales Dashboard from scratch
How to create an HR Dashboard from scratch

Who should take this training

Prerequisites

  • Microsoft Excel for Windows.
  • The course was created using Excel 2019/365 for Windows.
  • All of the code used in this course except for one property is compatible for Excel 2007, Excel 2010, Excel 2013, Excel 2016 and Excel 2019.
  • Intermediate knowledge of Microsoft Excel.

Target audience

  • Those wanting to create visually appealing dashboards in Excel Users with basic knowledge of Excel 2019/365 and those upgrading from previous software versions Users who have a foundation of Microsoft Excel and seeking to advance their Excel 2019/365 knowledge.

About this training

We’ll teach you how to create dashboards that look amazing, that are fully interactive so you (or anyone else!) can change the data they are seeing, and that can be updated with new data in a couple of clicks.

In this advanced Excel course, we look at how to create stunning, interactive dashboards in Excel.

  • Creating a fully interactive Sales Dashboard from scratch.

  • Creating a fully interactive HR Dashboard from scratch.

    This course includes:

    1. 9+ hours of video tutorials

    2. 70+ individual video lectures

    3. Exercise files to practice what you learned

    4. Certificate of completion

    This course was recorded using Excel 365. It's also relevant to those using other, recent versions of Microsoft Excel including Excel 2019, 2016, and 2013.

Course Language : EN
On-demand video
Full lifetime access to videos
Downloadable resources
Assignments
Certificate of Completion

Training options

Only Videos

$ 30

  • Full lifetime access to videos
  • Downloadable resources
  • Certificate of Completion
  • Hours of Individual Coaching

Blended

$ 290

  • Full lifetime access to videos
  • Downloadable resources
  • Certificate of Completion
  • 10 Hours of Individual Coaching
Save 10%

Blended

$ 520 $ 495

  • Full lifetime access to videos
  • Downloadable resources
  • Certificate of Completion
  • 20 Hours of Individual Coaching
Save 20%

Blended

$ 810 $ 648

  • Full lifetime access to videos
  • Downloadable resources
  • Certificate of Completion
  • 30 Hours of Individual Coaching
Course Content

1. Section 1: Course Introduction
1. Introduction to Excel Dashboards 02:22 mins
2. Course Exercise Files 01:29 mins
2. Section 2: Dashboard Setup
1. Spreadsheet Architecture 03:28 mins
3. Section 3: Design Inspiration
1. Dashboard Design Inspiration and Resources 05:34 mins
4. Section 4: Preparing Data for Analysis
1. Why Clean Data? 05:42 mins
2. Remove Blanks and Duplicates 05:51 mins
3. Use Text Functions to Clean Data 07:50 mins
4. Find and Replace 05:07 mins
5. Convert Numbers Stored as Text to Numbers 04:55 mins
6. Spell Check 04:42 mins
7. Format Data 09:58 mins
Exercise 01 05:32 mins
Financial Sample Data
Text Functions
Find and replace
Convert Numbers
Spell Check
Format as Table
Exercise 01
Exercise 01 - Solution
5. Section 5: Useful Excel Formulas
1. Basic INDEX and MATCH 12:32 mins
2. XLOOKUP (Microsoft 365 Users) 09:55 mins
3. Dependent, Dynamic Drop-down Lists 14:46 mins
4. SUMIFS and COUNTIFS 14:06 mins
5. LARGE and SMALL 04:49 mins
6. CHOOSE function 12:01 mins
7. Use CHOOSE with Form Controls and Charts 05:53 mins
8. The INDIRECT function 11:51 mins
9. Extracting Unique Values: UNIQUE and the Advanced Filter 07:28 mins
Exercise 02 07:34 mins
Basic INDEX and MATCH
XLOOKUP
Dynamic Drop-down Lists
SUMIFS and COUNTIFS
LARGE and SMALL
CHOOSE function
Advanced Choose
INDIRECT
Extracting unique values
Exercise 02
Exercise 02 - Solution
6. Section 6: PivotTables and Pivot Charts
1. Create a PivotTable 07:42 mins
2. Manipulating PivotTable Data 08:32 mins
3. Number Formatting 04:33 mins
4. Value Field Settings 05:52 mins
5. Show Values As 08:33 mins
6. Create a Pivot Chart 09:45 mins
7. Formatting Pivot Charts - Part 1 12:41 mins
8. Formatting Pivot Charts - Part 2 11:14 mins
9. Slicers and Timelines 11:42 mins
10. GETPIVOTDATA() 13:33 mins
Exercise 03 07:08 mins
Create a PivotTable
Manipulating PivotTable Data
Number Formatting
Value Field Settings
Show Values As
Create a Pivot Chart
Formatting Pivot Charts - Part 1
Formatting Pivot Charts - Part 2
Slicers and Timelines
GETPIVOTDATA()
Exercise 03
Exercise 03 - Solution
7. Section 7: Advanced Chart Techniques
1. Add Total Values to Stacked Column Charts 09:18 mins
2. Dynamic Chart Titles and Slicer Macros 14:07 mins
3. Dynamic Map Charts 20:16 mins
Exercise 04 10:13 mins
Add Total Values to Stacked Column Charts
Dynamic Chart Titles and Slicer Macros
Dynamic Map Charts
Exercise 04
Exercise 04 - Solution
8. Section 8: Interactive Elements - Form Controls
1. Introduction to Form Controls 03:23 mins
2. Combo Box 09:11 mins
3. Check Box 11:02 mins
4. Option Button 08:26 mins
5. Spin Button 03:54 mins
6. List Box 04:53 mins
7. Scroll Bar 08:24 mins
Exercise 05 07:34 mins
Combo Box
Check Box
Option Button
Spin Button
List Box
Scroll Bar
Exercise 05
Exercise 05 - Solution
9. Section 9: Sales Analysis Dashboard
1. Dashboard Overview 04:53 mins
2. Data Setup 03:24 mins
3. Wireframe Design 03:41 mins
4. Form Controls: Combo Box Setup 04:51 mins
5. Headline Stats - SUMIFS, MAX, LARGE and INDEX and MATCH 12:50 mins
6. Sales Tables Calculations - IF, SUMIFS and COUNTIFS 12:20 mins
7. Map Chart - Dynamic Filled Map 08:18 mins
8. Discount Charts - Setup 09:01 mins
9. Stacked Column Chart - Dynamic with Totals 09:53 mins
10. Donut Chart - Dynamic with Icon 04:44 mins
11. Sparklines 07:44 mins
12. Conditional Formatting 10:55 mins
13. Dynamic Titles 03:16 mins
14. Assemble Dashboard - Part 1 11:12 mins
15. Assemble Dashboard - Part 2 06:32 mins
Data Setup
Wireframe Design
Combo Box Setup
Headline Stats
Sales Tables Calculations
Dynamic Filled Map
Discount Charts
Stacked Column Chart - Dynamic with Totals
Donut Chart - Dynamic with Icon
Sparklines
Conditional Formatting
Dynamic Titles
Assemble Dashboard - Part 1
Assemble Dashboard - Part 2
10. Section 10: HR Dashboard
1. Dashboard Overview 04:22 mins
2. Data Setup 03:38 mins
3. Headline Stats with Custom Number Formatting 05:30 mins
4. Gender Breakdown Infographic 13:54 mins
5. Age Distribution - Funnel Chart with Custom Slicer 07:20 mins
6. Diversity Tracker 03:55 mins
7. Active Employees - Grouping PivotTable Data 05:23 mins
8. Full Time vs Part Time - PivotTable and Pivot Chart 02:23 mins
9. Form Controls - Option Button Setup 04:38 mins
10. Employees by Job Level - Dynamic Column Chart with Title 06:27 mins
11. Doughnut Chart - Dynamic with Icon 05:03 mins
12. Top 3 Employees - XLOOKUP and LARGE 04:22 mins
13. New Hires - Line Chart with Timeline Slicer 06:29 mins
14. Assemble Dashboard 13:46 mins
15. Updating the Dashboard 02:13 mins
Exercise 06 01:42 mins
Dashboard Overview
Data Setup
Headline Stats
Gender Breakdown Infographic
Age Distribution - Funnel Chart with Custom Slicer
Diversity Tracker
Active Employees - Grouping PivotTable Data
Full Time vs Part Time - PivotTable and Pivot Chart
Form Controls - Option Button Setup
Employees by Job Level - Dynamic Column Chart with Title
Doughnut Chart - Dynamic with Icon
Top 3 Employees - XLOOKUP and LARGE
New Hires - Line Chart with Timeline Slicer
Assemble Dashboard
Updating the Dashboard
Exercise 06
11. Section 11: Course Close
Course Close 00:47 mins
Quiz : Excel Dashboards Questions and Answers

Request more information

Similar courses

Join our mail list for news